
Thread-Local Allocation Buffers in JVM
Let’s take a look at this innocent, elegant and magnificent masterpiece:
Object foo = new Object();A solid weekend of hacking! That’s all we need to implement a run-time capable of performing such simple tasks! I mean, How hard can it be? Let’s See!
Run-Time Data Areas in JVM
JVM defines various run-time data areas which a particular application can use during its execution. The JVM Heap is one of those areas with two fundamental properties:
- It’s shared between all threads.
- It’s created when JVM starts.
So, all threads can potentially have access to each piece of the JVM heap. Let’s Suppose JVM is about to allocate an object for a particular thread. For some reason, it chose the depicted area as the allocation area for the new object but the allocation has not been done, yet:

Still, a simple task unless the vicious OS decides to give this CPU slice to another thread! Context switch! enters the second thread with a demand for new object allocation. What if the JVM chooses the same area for this new allocation, too? Same story if we are bad luck enough experiencing two truly parallel object allocations!
Is there any way to synchronize multiple threads regarding how they can access the JVM heap? Again, a simple solution: Lock, lock and more lock!.
A Poor Man’s Allocation
Since objects are allocated directly in a shared space, the Eden Space, we need some sort of synchronization to avoid allocating two objects in the same pointer space.
The first solution comes to mind is to use locks! That is, JVM should grant exclusive access to a thread for a particular region of heap every time it’s going allocate an object, every single time.
Imagine a run-time that its threads are always acquiring and releasing some locks, even if there were no contention at all.
Shared Mutable State
As with many other thread-safety challenges in multi-threaded environments, we should somehow manage the mutable states shared between multiple threads. If we can’t do something about those states, then we may not find a better solution than locks!
But if we could find a way to eliminate one of those three key properties, then there would be no need for a synchronization:
- When we’re talking about the JVM heap, the state is the pointer space we’re going to use for allocations. Unfortunately, We need this state.
- In order to be able to allocate objects, we need to mutate the pointer space, so we can’t do anything about the mutation, either.
Do we need to allocate new objects in a shared pointer space?
Thread-Local Allocation Buffers
Although a few new GC algorithms are not strictly following the generational idea, let’s us to have the luxury of visualizing the JVM heap as following:
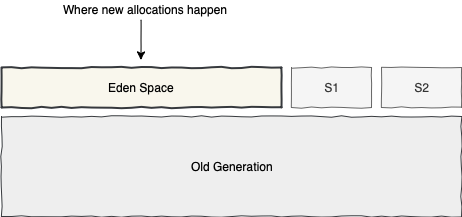
When the insane-mode is off, all new object allocations should happen in the Eden Space. Dedicating a sub-region of the whole heap for new allocations is one of the reasons that the new allocations are so fast in JVM.
As it turns out, for even more faster allocations, JVM divides the Eden space into a few more sub-regions, each dedicated to a particular thread. Each of those dedicated regions is called Thread-Local Allocation Buffers or TLAB for short.
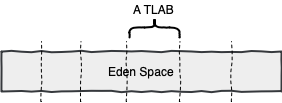
When allocating a new object, JVM would allocate that object in the TLAB dedicated to the original thread. Since each thread can only write to its own TLAB, then there is no need for synchronization. TLABs are enabled by default but if you’re insane enough, you can always disable it using the -XX:-UseTLAB tuning flag.
TLAB Sizing
If the -XX:TLABSize flag was set to a positive number (Defaults to zero), then the initial size of a TLAB would be equal to -XX:TLABSize divided by Heap Word Size. Otherwise, the initial size would be a function of the average number of allocating threads. Also, the TLAB size can’t be:
- More than a maximum value.
- Less than a minimum value determined by
-XX:MinTLABSizeflag.
If the -XX:ResizeTLAB is enabled (Which is by default), then JVM can adaptively resize the TLAB size. The new size is always depends on three major factors:
- Number of application threads
- Allocation rate
- Eden Size
Retiring TLABs
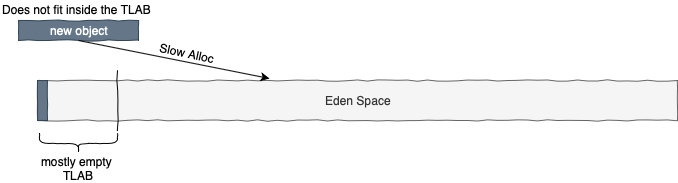
When an object does not fit inside a TLAB, either TLAB is full or the object is too big, JVM has two options:
- Allocating the object outside of the TLAB. Since the allocation happens directly inside the Eden space, it’s called a Slow Allocation.
- Creating a new TLAB and allocating that object inside the new one. Technically speaking, JVM Retires the old TLAB.
When the TLAB is far from being full, then it may make sense to allocate bigger objects outside of it:
On the contrary, when the TLAB is almost full, even the smallest objects may not get a chance for a fast allocation:
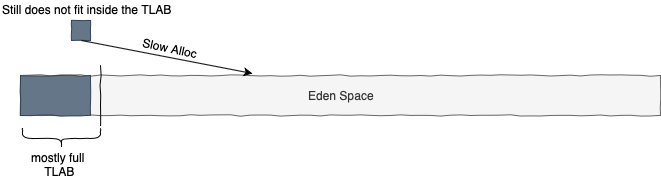
So depending on the TLAB state, both options are valid.
Which option do you prefer? How about both! When the object size is larger than a threshold, then JVM would use a slow allocation. Otherwise, it retires the TLAB and allocates that object inside the new one. By default, this threshold is equal to 1% of the TLAB size and is determined by the -XX:TLABWasteTargetPercent=N flag (The default value is 1).
As the number of slow allocations increases, in order to lower the chance of more slow allocations, JVM increments the TLABWasteTargetPercent by some value determined by
the -XX:TLABWasteIncrement=N (Default value is 4). For example, first slow allocation happens when the object is larger than 1% of the TLAB. The second one happens, if it’s larger than the 5% of TLAB.
Basically, JVM is using a heuristic to guess how much of a TLAB is full at any given moment. As the number of slow allocations increases, the probability of the TLAB being full goes up.
TLAB Waste
When JVM allocates a large object outside of a TLAB, then the remaining space of that TLAB is wasted because of a slow allocation. For example, if JVM allocates a 30KB object outside of a 100KB TLAB, when 75KB of it is full, then those remaining 25KB is wasted.
Also, during a minor GC, the remaining space of each TLAB would be wasted because of a GC. Generally, when JVM retires a TLAB, the free remaining space of that TLAB would be considered as wasted.
Logging TLABs
If we run our Java application with the -XX:+PrintTLAB flag, then JVM would log the TLAB usage during each Minor GC. First, it prints TLAB usage for each thread in a separate line:
TLAB: gc thread: 0x00007f87b9321000 [id: 39707] desired_size: 3291KB
slow allocs: 7  refill waste: 52656B alloc: 0.44830   164574KB
refills: 111 waste  1.0% gc: 0B slow: 584B fast: 13008B
Let’s demystify this cryptic log:
- This was logged while performing a minor gc, hence the keyword
gc. - The
desired_sizerepresents the TLAB size for the current thread in KB. - Since the last minor GC, JVM allocated 7 objects directly inside the Eden (
slow allocs), which accounted for 44% of all allocations (alloc) and 164574 KB. - 1% percent of this thread’s TLAB was wasted (
waste), mainly because of 584 bytes of slow allocations and 13008 bytes of a special fast allocator! - TLAB filled with filler objects and refilled 111 times.
- The
refill wasterepresents the threshold for TLAB Retirement. If the remaining free space of the TLAB is more than this limit, then JVM would happily allocate a large object outside of the TLAB. Otherwise, it retires the current TLAB and creates a new one. After each slow allocation, JVM increments this value by-XX:TLABWasteIncrement=N.
After those per-thread statistics, JVM prints a line of summary data:
TLAB totals: thrds: 13  refills: 123 max: 111 slow allocs: 16 max 7 waste:  2.0%
gc: 7485752B max: 1566728B slow: 584B max: 584B fast: 13008B max: 13008B
Surely this part seems less cryptic:
threads: Since the last minor GC, 13 threads were actively allocating objects.refills: Total number of TLAB refills was 123, 111 was the maximum of refills between all TLABs.slow allocs: Total number of slow allocations was 16, 7 of them was performed just by one thread.waste: We had 2% percent TLAB space waste overall because of slow allocations, gc and fast allocator.