
False Sharing
Sometimes the most innocent looking pieces of codes can hurt the overall latency or throughput of the system. In this article, we’re going to see how false sharing can turn multithreading against us.
Let’s start with a simple contract for counting:
public interface Counter {
    long inc(int index);
}
Each implementation encapsulates a collection of counters. The inc method is responsible for incrementing the counter at the given index.
Atomic Counters
Let’s start with 8 distinct counters:
public class SimpleCounter implements Counter {
    private volatile long v1;
    private volatile long v2;
    private volatile long v3;
    private volatile long v4;
    private volatile long v5;
    private volatile long v6;
    private volatile long v7;
    private volatile long v8;

    // omitted
}
We’re going to increment each of these values atomically. Also, to avoid the extra memory footprint associated with the AtomicLongs, we will use VarHandles here:
private static final VarHandle V1;
private static final VarHandle V2;
// one VarHandle per counter

static {
    try {
        V1 = MethodHandles.lookup().findVarHandle(SimpleCounter.class, "v1", long.class);
        V2 = MethodHandles.lookup().findVarHandle(SimpleCounter.class, "v2", long.class);
        // omitted
    } catch (Exception e) {
        throw new ExceptionInInitializerError(e);
    }
}
The inc(int index) method increments the counter at the given index:
public long inc(int index) {
    switch (index) {
        case 1: return (long) V1.getAndAdd(this, 1);
        case 2: return (long) V2.getAndAdd(this, 1);
        // omitted
    }

    return 0;
}
First Benchmark
The following benchmark would run the inc method with 8 threads under heavy load. Each thread is going to call the method with a distinct index. Therefore, there won’t be any contention as the thread i operates on the ith counter:
@Threads(8)
@OutputTimeUnit(TimeUnit.NANOSECONDS)
public class FalseSharingVictimBenchmark {

    private static final SimpleCounter simple = new SimpleCounter();
    private static final AtomicInteger threadCounter = new AtomicInteger(1);
    private static final ThreadLocal<Integer> id = ThreadLocal
        .withInitial(threadCounter::getAndIncrement)

    @Benchmark
    @BenchmarkMode(AverageTime)
    public long simple() {
        return simple.inc(id.get() % 8);
    }
}
Running this benchmark would result in something like:
Result "me.alidg.FalseSharingVictimBenchmark.simple":
  170.423 ±(99.9%) 4.913 ns/op [Average]
  (min, avg, max) = (155.715, 170.423, 187.665), stdev = 10.988
  CI (99.9%): [165.510, 175.335] (assumes normal distribution)
On average each inc call takes about 170 nano seconds to complete.
Let’s see if we can improve this situation.
Know Your Object Layout
If we run the following:
ClassLayout.parseClass(SimpleCounter.class).toPrintable()Then JOL will print the object layout for the SimpleCounter:
me.alidg.SimpleCounter object internals:
 OFFSET  SIZE   TYPE DESCRIPTION                               VALUE
      0    12        (object header)                           N/A
     12     4        (alignment/padding gap)
     16     8   long SimpleCounter.v1                          N/A
     24     8   long SimpleCounter.v2                          N/A
     32     8   long SimpleCounter.v3                          N/A
     40     8   long SimpleCounter.v4                          N/A
     48     8   long SimpleCounter.v5                          N/A
     56     8   long SimpleCounter.v6                          N/A
     64     8   long SimpleCounter.v7                          N/A
     72     8   long SimpleCounter.v8                          N/A
Instance size: 80 bytes
Space losses: 4 bytes internal + 0 bytes external = 4 bytes total
We can visualize this layout as something like:
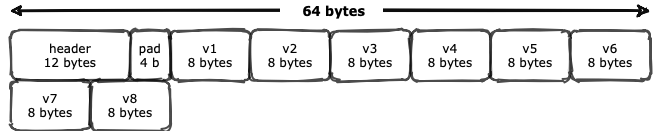
It follows the typical OOP or Ordinay Object Pointer structure in JVM: an object header immediately followed by zero or more references to instance fields. The header itself consists of one mark word, one klass word, and a 32-bit array length (only for arrays) which is 12 bytes in total. Also, JVM may add some paddings for alignment purposes.
Immediately after object header and padding, there are 8 references to those 8 long instance fields.
We can also verify this layout using the lovely sun.misc.Unsafe:
private final SimpleCounter counter = new SimpleCounter();
private final Unsafe unsafe = getUnsafe();

@Test
void verifyingSimpleCounterMemoryLayout() {
    assertEquals(16, offsetOf("v1"));
    assertEquals(24, offsetOf("v2"));
    assertEquals(32, offsetOf("v3"));
    assertEquals(40, offsetOf("v4"));
    assertEquals(48, offsetOf("v5"));
    assertEquals(56, offsetOf("v6"));
    assertEquals(64, offsetOf("v7"));
    assertEquals(72, offsetOf("v8"));
}

private long offsetOf(String fieldName) {
    return unsafe.objectFieldOffset(getField(counter.getClass(), fieldName));
}
Padding: Random Encounter
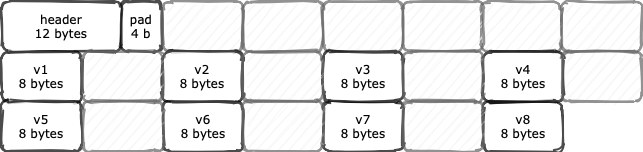
Let’s see how adding some paddings between counters affect the latency. First, isolating the counters from the object header by adding 6 long values before v1:
public class Padded1Counter implements Counter {

    // Isolating v1 from the object header and 4 bytes of padding
    private long p01, p02, p03, p04, p05, p06 = 0;
    private volatile long v1;

    // omitted
}
6 long values plus 12 bytes of object header plus 4 bytes of padding added by JVM is equal to 64 bytes (More on this 64 magic number later).
Then we’re going to separate each counter by one long value:
public class Padded1Counter implements Counter {

    private long p01, p02, p03, p04, p05, p06 = 0;

    private volatile long v1;
    private long p11 = 0;

    private volatile long v2;
    private long p21 = 0;

    // repeat this
}
Here’s how JVM lays out the Padded1Counter in heap:
If we benchmark Padded1Counter against the SimpleCounter:
Benchmark                              Mode  Cnt    Score   Error  Units
FalseSharingVictimBenchmark.padded1    avgt   60  120.444 ± 4.263  ns/op
FalseSharingVictimBenchmark.simple     avgt   60  170.423 ± 4.913  ns/op
Quite surprisingly, the Padded1Counter outperforms the SimpleCounter in terms of latency.
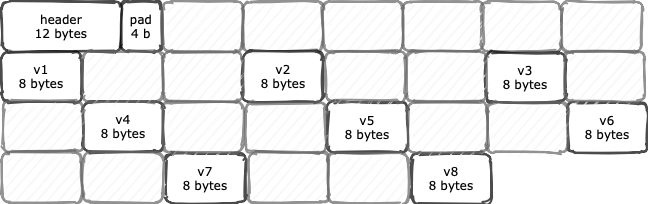
Let’s add another 8 bytes between counters:
public class Padded2Counter implements Counter {

    private long p01, p02, p03, p04, p05, p06 = 0;
    private volatile long v1;
    private long p11, p12 = 0;

    private volatile long v2;
    private long p21, p22 = 0;

    // you get the idea
}
The memory layout turns out to be like this:
And the benchmark result is again interesting:
Benchmark                              Mode  Cnt    Score   Error  Units
FalseSharingVictimBenchmark.padded1    avgt   60  120.444 ± 4.263  ns/op
FalseSharingVictimBenchmark.padded2    avgt   60  107.887 ± 2.729  ns/op
FalseSharingVictimBenchmark.simple     avgt   60  170.423 ± 4.913  ns/op
If we continue to add more paddings until we reach 7 bytes of padding, the memory layout would as isolated as:
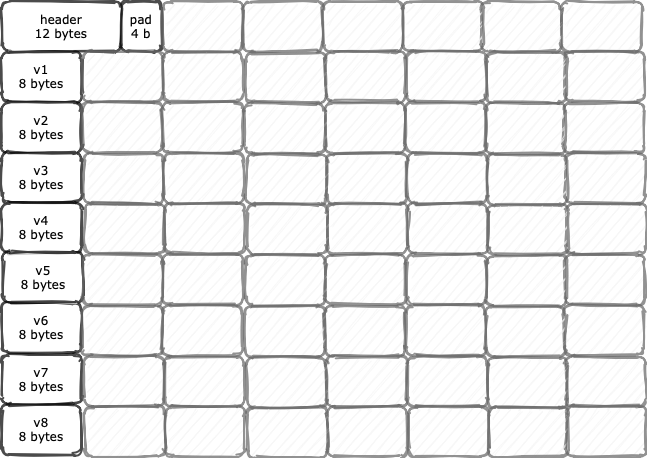
Each counter resides on its own 64 bytes isolated area. Let’s see how’s the benchmark looks like after all this:
Benchmark                              Mode  Cnt    Score   Error  Units
FalseSharingVictimBenchmark.padded1    avgt   60  120.444 ± 4.263  ns/op
FalseSharingVictimBenchmark.padded2    avgt   60  107.887 ± 2.729  ns/op
FalseSharingVictimBenchmark.padded3    avgt   60   91.285 ± 2.015  ns/op
FalseSharingVictimBenchmark.padded4    avgt   60   88.319 ± 3.045  ns/op
FalseSharingVictimBenchmark.padded5    avgt   60   84.910 ± 4.142  ns/op
FalseSharingVictimBenchmark.padded6    avgt   60   72.000 ± 6.060  ns/op
FalseSharingVictimBenchmark.padded7    avgt   60   65.932 ± 3.191  ns/op
FalseSharingVictimBenchmark.simple     avgt   60  170.423 ± 4.913  ns/op
Performance Monitoring Counter
To instrument low-level CPU events, such as cycles, stall cycles, instructions, or memory loads/stores, one can program special hardware registers on the processors.
As it turns out, tools like perf or BPF are already using this approach to expose useful metrics. As of Linux 2.6.31, perf is the standard Linux profiler capable of exposing useful Performance Monitoring Counters or PMCs.
We can use perf_events to see what’s going on at the CPU level when running each of those benchmarks. For instance, if we run:
>> perf stat -d java -jar benchmarks.jar simple Then perf would run the benchmark against the SimpleCounter and then expose some CPU PMCs as follows:
161657.133662      task-clock (msec)         #    3.951 CPUs utilized
         9321      context-switches          #    0.058 K/sec
          185      cpu-migrations            #    0.001 K/sec
        20514      page-faults               #    0.127 K/sec
            0      cycles                    #    0.000 GHz
 219476182640      instructions
  44787498110      branches                  #  277.052 M/sec
     37831175      branch-misses             #    0.08% of all branches
  91534635176      L1-dcache-loads           #  566.227 M/sec
   1036004767      L1-dcache-load-misses     #    1.13% of all L1-dcache hits
The SimpleCounter benchmark had 1,036,004,767 (~ 1 billion) L1 data cache misses. If we run the same profiling with the Padded7Counter:
161742.243922      task-clock (msec)         #    3.955 CPUs utilized
         9041      context-switches          #    0.056 K/sec
          220      cpu-migrations            #    0.001 K/sec
        21678      page-faults               #    0.134 K/sec
            0      cycles                    #    0.000 GHz
 692586696913      instructions
 138097405127      branches                  #  853.812 M/sec
     39010267      branch-misses             #    0.03% of all branches
 291832840178      L1-dcache-loads           # 1804.308 M/sec
    120239626      L1-dcache-load-misses     #    0.04% of all L1-dcache hits
The Padded7Counter encountered 120,239,626 cache misses, almost 900 million fewer cache misses compared to the simple approach.
What is the cause of such a difference between almost two identical implementations?
Cache Line and Coherency
CPU caches are working in terms of Cache Lines. That is, the cache line is the unit of transfer between CPU caches and the main memory.
Basically, processors tend to cache a few more values in addition to the requested one. This spatial locality optimization usually improves both throughput and latency of memory access.
However, when two or more threads are competing for the same cache line, multithreading may have a counterproductive effect, as they need to coordinate the cache access with each other.
Maintaining the uniformity of shared values in different caches is knowon as cache coherency. There are different protocols for maintaining the cache coherency such as MESI or Modified, Exclusive, Shared, and Invalid.
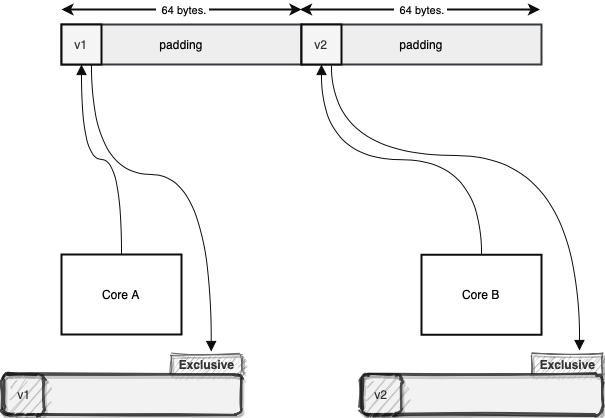
Let’s see how all this works in terms of the MESI coherency protocol. Core A and B are reading different values in different memory locations but in the same memory area. First, the Core A reads the value v1:
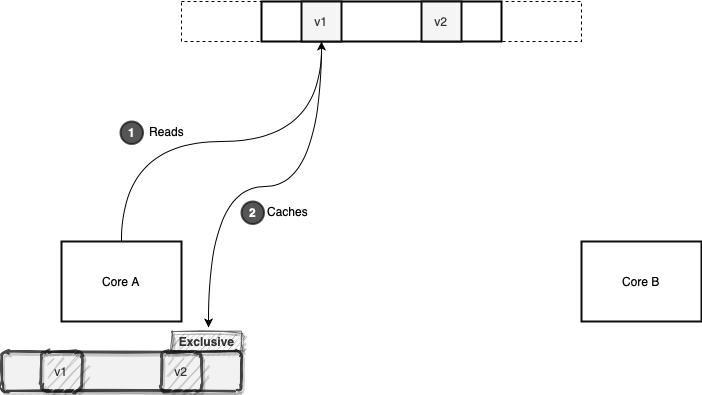
As shown above, this core now has exclusive access to this particular cache line. After a while, Core B reads the v2 value. The v1 and v2 are residing in the same cache line. Therefore, the cache line state changes to shared, as two cores are sharing it:
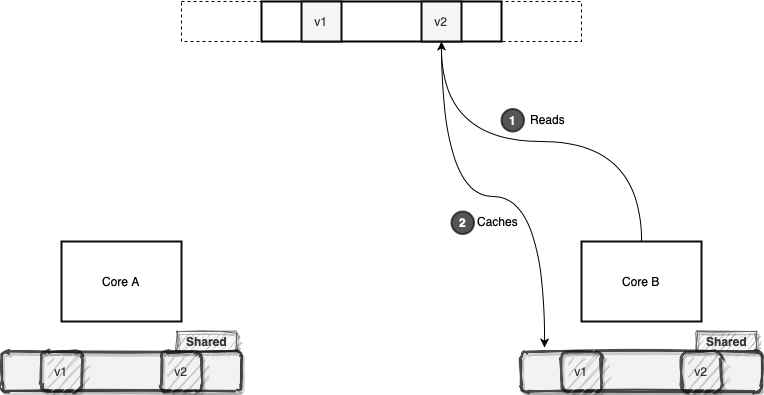
From now on, if these two cores want to read any value from this cache line, they will avoid the memory access and just read the cache line. However, this efficiency can be fragile, as one of these cores may decide to modify something in this cache line.
For the sake of argument, let’s suppose Core B decides to increment the value of v2:
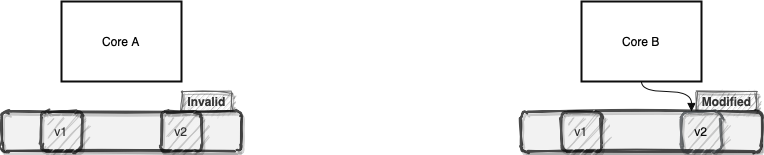
Now Core B tags its cache line as modified and communicates this state transition with the Core A. Core A, in turn, will re-tags its cache line as invalid. Usually, the processors will buffer such modifications in their store buffers before flushing it back to the main memory. Buffering and flushing back in batches can be a huge performance boost.
Now let’s suppose Core A decides to read any value from its invalid cache line:
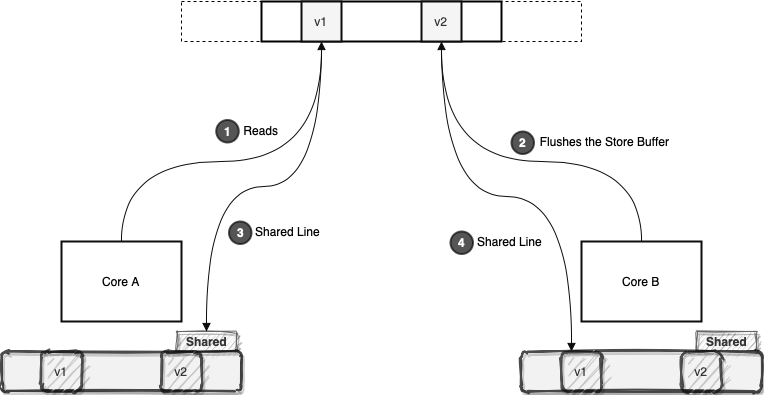
Since this cache line is invalid for Core A, it should read it again from the memory. This will force Core B to flush its modifications back to the memory. After that, both cores will cache the same line in the shared state.
Now imagine this process to happen millions of times each second. That’s the reason behind the poor performance of our simple counter: constant in-efficient memory access.
False Sharing
We saw different cores were reading from or writing to different memory locations. Despite that, because those different values happened to be in the same cache line, changing one value induced a cache miss to another core.
This phenomenon, known as false sharing, can impose a lot of cache misses to different cores. This will, in turn, degrade the overall performance of the application.
Quite interestingly, the common solution for false sharing is another memory-speed tradeoff.
Padding Revisited
To prevent false sharing, we can add enough garbage around each contended value:
This way each contended value will reside on its own cache line. Consequently, we will avoid unwanted contention between different cores, as each core gains exclusive access to its cache line. However, if two core operates on the same value, they will share the same cache line, which is reasonable.
In most modern hardware architectures, the cache line size is around 64 to 128 bytes. So, adding, say, 7 other long values around the actual long will probably isolate that long variable in a separate cache line.
We say probably because memory layout of objects is a complicated subject in language runtimes such as JVM. Therefore, we should be sure about the layout before adding the padding.
Anyway, we can find the cache line size in macOS by asking from sysctl:
$ sysctl machdep.cpu.cache.linesize
64
On Linux:
$ getconf LEVEL1_DCACHE_LINESIZE
64
Please note that, we should only add these sorts of paddings around contended values. Otherwise, we’re trading some more memory for nothing special in return!
Speaking of which, let’s see if there is a better way to avoid false sharing in Java.
@Contended
The jdk.internal.vm.annotation.Contended annotation (sun.misc.Contended if you’re on Java 8) is a hint for the JVM to isolate the annotated fields to avoid false sharing. So we can rewrite our counters as the following:
public class ContendedCounter implements Counter {

    @jdk.internal.vm.annotation.Contended
    private volatile long v1;

    // well, do repeat yourself!
}
Now if we inspect the memory layout of this class, we should see lots of padding around each field:
me.alidg.ContendedCounter object internals:
 OFFSET  SIZE   TYPE DESCRIPTION                               VALUE
      0    12        (object header)                           N/A
     12     4        (alignment/padding gap)
     16     8   long ContendedCounter.v1                       N/A
     24     8   long ContendedCounter.v2                       N/A
     32     8   long ContendedCounter.v3                       N/A
     40     8   long ContendedCounter.v4                       N/A
     48     8   long ContendedCounter.v5                       N/A
     56     8   long ContendedCounter.v6                       N/A
     64     8   long ContendedCounter.v7                       N/A
     72     8   long ContendedCounter.v8                       N/A
Instance size: 80 bytes
Space losses: 4 bytes internal + 0 bytes external = 4 bytes total
OOPS! The @Contended annotation is in an internal package for a good reason. By default, only JDK internal abstractions can use this annotation. Therefore, there is no padding in the above example.
However, if we’re so persistent in shooting ourselves in the foot, we can use the -XX:-RestrictContended tuning flag to remove this restriction:
me.alidg.ContendedCounter object internals:
 OFFSET  SIZE   TYPE DESCRIPTION                               VALUE
      0    12        (object header)                           N/A
     12   132        (alignment/padding gap)
    144     8   long ContendedCounter.v1                       N/A
    152   128        (alignment/padding gap)
    280     8   long ContendedCounter.v2                       N/A
    288   128        (alignment/padding gap)
    416     8   long ContendedCounter.v3                       N/A
    424   128        (alignment/padding gap)
    552     8   long ContendedCounter.v4                       N/A
    560   128        (alignment/padding gap)
    688     8   long ContendedCounter.v5                       N/A
    696   128        (alignment/padding gap)
    824     8   long ContendedCounter.v6                       N/A
    832   128        (alignment/padding gap)
    960     8   long ContendedCounter.v7                       N/A
    968   128        (alignment/padding gap)
   1096     8   long ContendedCounter.v8                       N/A
Instance size: 1104 bytes
Space losses: 1028 bytes internal + 0 bytes external = 1028 bytes total
By default, @Contended adds 128 bytes padding around each annotated field:
/* Need to limit the extent of the padding to reasonable size.          */
/* 8K is well beyond the reasonable HW cache line size, even with       */
/* aggressive prefetching, while still leaving the room for segregating */
/* among the distinct pages.                                            */
product(intx, ContendedPaddingWidth, 128,
          "How many bytes to pad the fields/classes marked @Contended with")
          range(0, 8192)
          constraint(ContendedPaddingWidthConstraintFunc,AfterErgo)
As shown above, this value is also configurable through -XX:ContendedPaddingWidth tuning flag.
Anyway, the @Contended version has similar performace characteristics to the one with 7 8-bytes padding:
Benchmark                              Mode  Cnt    Score   Error  Units
FalseSharingVictimBenchmark.padded7    avgt   60   65.932 ± 3.191  ns/op
FalseSharingVictimBenchmark.contended  avgt   60   62.154 ± 1.495  ns/op
Conclusion
In recent years, the @Contended annotation has been used in JDK internal stuff to avoid false sharing. Here are a few notable examples:
- The
Threadclass to store the random seed - The
ForkJoinPoolexecutor - The
Exchangerconcurrent utility - The
ConcurrentHashMap - And the
Striped64to implement counters and accumulators with high throughput (sounds familiar?)
Also, here are a few more pointers on how this annotation works:
-XX:+EnableContendedtuning flag to enable/disable the padding. By default, it’s enabled- Cotention groups
- If we annotate a whole class with
@Contended, then JVM will adds some padding before all the fields - Padding for fields
Also, in the article, we briefly talked about the memory layout of objects in JVM. For a more detailed exploration, it’s highly recommended to check out the oops section of the JVM source code. Also, Aleksey Shipilëv has a much more in-depth article in this area.
Moreover, more examples of JOL are available as part of the project source code.
As usual, all the examples are available over on GitHub.